In order to increase the quality of your transactions and achieve optimal profitability, it is necessary to have appropriate and referable analyzes first of all.
When you can analyze the current state of the digital currency market and predict its future, you will naturally make reasonable decisions based on your knowledge.
This type of trading will be much more effective than trading without knowledge and awareness.
As an important element, technical analysis plays an important role in your progress and you need to pay special attention to it.
Charts are full of useful information that will guide you in identifying the best position to buy and sell currencies.
In this article, we will mention some common price patterns for digital currency price analysis, which you need to master including:
- What is a price pattern and what is its use?
- Some top price patterns to improve trading quality
- Price channel
- Ascending and descending triangle pattern
- Head and shoulders pattern
What is a price pattern and what is its use?
Price patterns are actually your interpretation of the charts. The art of chart reading and understanding is very important in the crypto world and every professional trader should be able to have a correct understanding of available charts.
At first glance, you might think that cryptocurrency price movements are completely random and meaningless. But with a little investigation, you will find that there is a relationship and a pattern between them that can be used to predict the future price.
Analysts believe that the price of digital currencies follows certain patterns that should be identified.
Also, they believe that history repeats itself regularly and that is why the history of currency prices can be used to understand the future.
Patterns can be derived from the lines resulting from connecting the digital currency price points. In the following, by addressing these patterns, you will find a correct understanding of them.
Some top price patterns to improve trading quality
There are hundreds of different price patterns in the digital currency market that can be true in some specific situations.
But ultimately those patterns are acceptable to apply in a wider range of situations. Each of the patterns that are known and useful among traders have been tested many times on different charts and now we present them to you.
The following are some of the most prominent cryptocurrency price patterns that you should be aware of.
Price channel
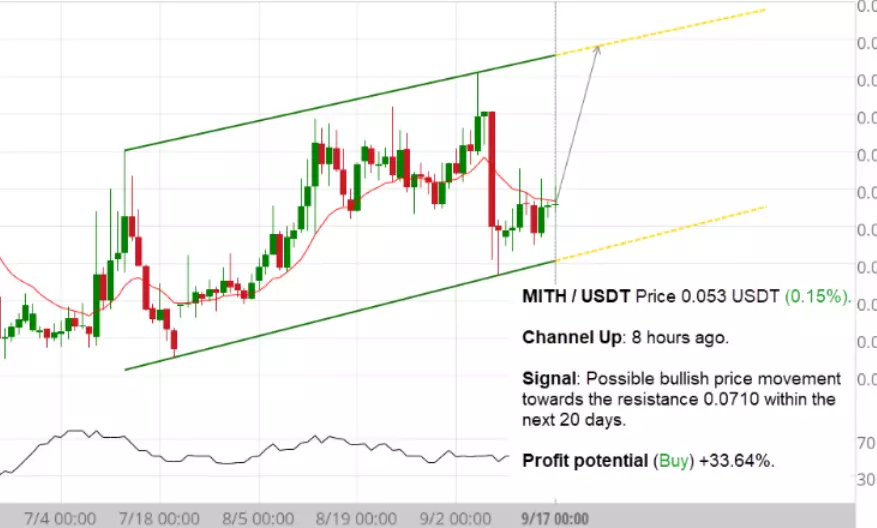
The price channel is one of the patterns that you can use to analyze the price of digital currency.
These channels are actually created between the support and resistance lines and can show you the range of buying and selling. The line that you see in the upper part is the highest price that the currency in question will reach according to the current situation as well as predictions.
The bottom line is considered the minimum price. These two parallel lines create a range called a price channel.
The resistance lines show the area where the digital currency market prevents the currency from increasing in price further.
As a result, after that, it takes a downward trend.
In this area, traders sell their currencies. The resistance zone actually prevents the price of the currency from falling further, and after that we can expect the price to rise.
The resistance level is the best time to buy digital currency at the lowest price.

Ascending and descending triangle pattern
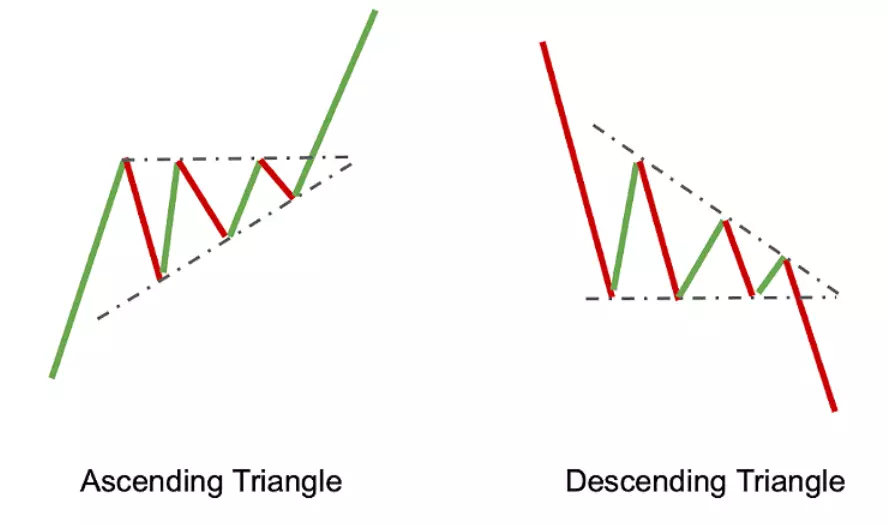
The triangle pattern is one of the types of patterns that can predict price breakouts. To draw this pattern, you should consider the price ceiling and floor.
When the digital currency price ceilings are connected by a straight line, and the price floors are higher at any moment than the previous moment, a sloping line will be drawn in an ascending state.
In this case, you can see that a right-angled triangle is formed, which is called an ascending triangle pattern. This pattern can indicate a bullish breakout.
On the other hand, if the price floors are equal to each other, they will form a straight line, and if the ceilings are lower at any moment than the previous moment, they will form a descending line.
These two lines can form a descending triangle, which indicates a downward failure of the digital currency price. In this bearish mode, the price of digital currency can be expected to experience a sharp drop at once. Just the opposite of what happens in an ascending triangle.

Head and shoulders pattern
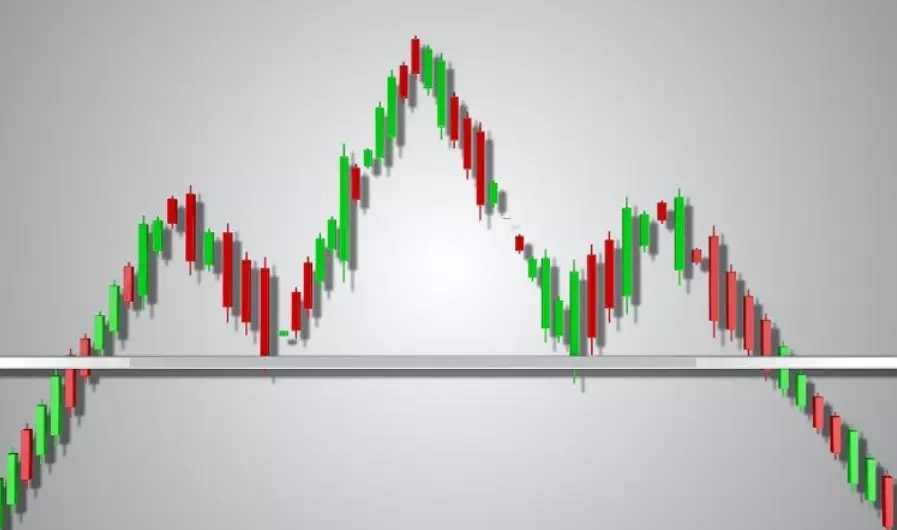
The Head and Shoulders pattern is another price pattern that you can use to check the list of digital currencies and predict their prices.
The head and shoulders pattern is actually a reversal pattern. This means that whenever it is seen in the chart, we can expect a change in the direction of the price movement.
When the price starts to increase, the fear and greed index increases in the market and people tend to buy digital currency.
However, based on laws such as resistance lines and the amount of supply and demand, at some point this progress will stop and reverse movement will begin. On the other hand, when the digital currency market experiences a downtrend, many people fall into FOMO and sell their assets.
Meanwhile, based on the head and shoulder pattern, we can expect the price to break at one point and start an upward trend. The head and shoulders pattern can be a good pattern to check the list of digital currency and predict their price.

In this article, we mentioned only a few of the digital currency price patterns. In order to carry out your trades in the best way, you need to have complete information about these charts and their analysis.
Many times, even though you think you have made the best possible decision to buy and sell currencies, the market will have sudden changes and the price of digital currencies will change all at once.
Knowledge of chart analysis helps predict these changes. You can strengthen your information in this field by continuous study and also get help from famous traders and their analysis.


